

Every Floor.
Every Dollar.
Defensible market value, layer by layer — retail podiums, residential towers, parking structures, office wings. One parcel. One report. No guesswork.
Aerial Site Analysis
& Zoning Classification
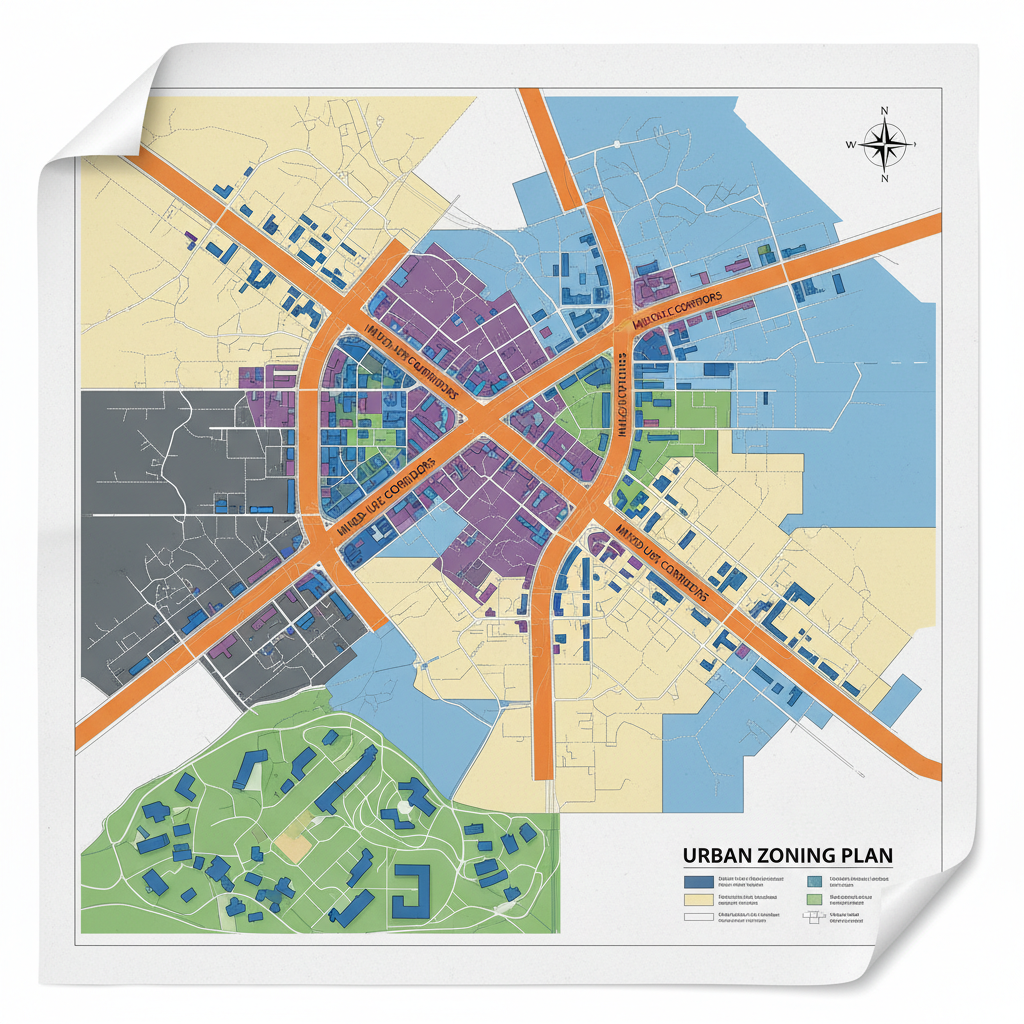
Before any income model runs, we establish the regulatory envelope — every applicable zoning classification, FAR constraint, use-type permission, and overlay district that defines what the building legally is and what it can become.
Comparable sales are filtered by use-type composition, not just geography. A tower with 30% retail at grade is not comparable to a pure residential tower two blocks away.
Income Capitalization
at Street Level
Retail within mixed-use buildings behaves differently from standalone strip centers. Captive residential foot traffic, co-tenancy premiums, and podium configuration all move the needle on cap rates by 40–80 basis points.
We apply the Income Capitalization Approach to each retail subdivision independently — anchor, in-line, food service, and amenity retail are each assigned market rent, vacancy deduction, and a use-appropriate cap rate drawn from verified closed transactions.
| Use / Floor | GLA (SF) | Mkt Rent/SF | Stabilized NOI | Cap Rate | Indicated Value |
|---|---|---|---|---|---|
| Ground Floor — Anchor Retail | 12,400 | $52.00 | $644,800 | 5.2% | $12.4M |
| Ground Floor — In-Line Retail | 4,800 | $68.00 | $326,400 | 5.5% | $5.9M |
| Mezzanine — Food & Beverage | 3,200 | $44.00 | $140,800 | 6.0% | $2.3M |
| Podium — Fitness/Amenity Ret. | 2,600 | $38.00 | $98,800 | 6.2% | $1.6M |
| RETAIL COMPONENT TOTAL | 23,000 | — | $1,210,800 | 5.4% | $22.2M |
Unit-Mix Analysis
& Absorption Modeling
Residential towers within mixed-use developments carry a lease-up risk premium that stabilized comparable sales cannot fully capture. We model absorption explicitly.
Unit-mix composition, concession burn-off, and stabilized occupancy timing are each stress-tested against market absorption data from the prior 24 months of deliveries in the submarket.
Below-Grade Infrastructure
& Amenity Valuation
Parking structures in mixed-use developments are valued on a stall-by-stall revenue model, not as a single lump-sum residual. Premium valet stalls, monthly reserved contracts, and transient revenue each carry distinct cap rates.
Amenity spaces — roof decks, fitness centers, co-working areas — are valued on a contributory value basis: what they add to residential and office rents above what an identical building without them would command.
| Asset Layer | Indicated Value | % of Total |
|---|---|---|
| Retail Podium | $22.2M | 13% |
| Residential Tower | $147.4M | 84% |
| Office Wing | $18.6M | 11% |
| Parking & Amenities | $15.5M | 9% |
| As-Is Blended Total | $203.7M | 100% |
Ready to Close
with Certainty?
Provide parcel details below. Our senior appraisers will confirm scope, timeline, and fee within one business day.
Download a Sample
Mixed-Use Report
See exactly how we structure a 140-page mixed-use appraisal — section by section, methodology by methodology. Gate-free preview of pages 1–22.